Zachary F. Barnett
GEOG 350
FALL 2015
Abstract:
This project assessed the demographics of people within one mile of mental health care providers in the Antelope valley study area portion of Los Angeles County, California. The demographics come from TIGER census shape file data. This was done in an effort to see trends in order to start assessing relative need of mental health care. The results showed that Whites had the highest percentage of people that lived further than a mile away. African American showed the lowest percentage. Based on a purely spatial measurement white people are in the most need of mental health care services, however it known that that does not represent the economic realities of affluent suburbs and urban poor.
Introduction:
Mental illness is a very serious yet often ignored problem facing almost 1 in 5 adults (18.5%) in the United States. Providing access to mental health services is a vast problem due to social stigmas attached to the variety of illnesses and treatments. Only 41% of adults in the U.S. with a mental health condition received mental health services in the past year. Among adults with a serious mental illness, 62.9% received mental health services in the past year. Demographically, African and Hispanic Americans utilize mental health services at one half the rate of Caucasians. Asian American only utilized services at one third. This lack of treatment causes serious consequences for our country economically ($193.2 billion in lost earnings per year) and socially with over one third (37%) of students with a mental illness dropping out of school ages 14-21. Suicide is the 10th leading cause of death in this country and 2nd between people aged 15-24.(Source:NAMI.org, 2015) In addition senseless acts of gun violence that cannot be blamed on anything but mental illness seemingly raise the profile of the scope of the problem but do little to analyze or assess the lack of availability and again attach more stigmas to problem. Nevertheless, the problems persist.
Background:
Assessing areas of need of mental healthcare services is a difficult undertaking that needs assistance from geographic resources. According to the study Health Based Geographic Information Systems (GIS) and their Applications,
“factors such as the distance may have an influence over the use of mental health services and the long distance between healthcare systems and patients reduces the rate that patients used to visit to these departments. GIS can analyze and portray accurately the distribution of mental health services and they could explain the reasons why the accessibility in healthcare services is affected. More often than not, people who suffer from a serious mental illness are forced to relocate to areas that provide mental health services which are more accessible to them. On the other hand, such changes alone have a huge impact on mental health and the course of the disease. Therefore, the right and accurate arrangement of these services helps in order accessible services to each and every person to be both developed and designed” A GIS can find areas requiring attention and then looking at what the demographics are in order to better serve the cultural and economic needs of that particular area.”(Fradelos 5)
I looked at a Los Angeles County using a data set of mental health care providers as provided by the L.A. County GIS clearing house. Using this shapefile to analyze the problem of mental health access can be greatly beneficial in identifying areas of need to identify which communities are being underserved and do not have relative ease of access to services.
Upon looking at previous studies
done by the county, the measurement for understanding ease of access include
living within a service area as opposed to between areas. Generally living
between the service areas means that access to mental health services are
further away and under the specific jurisdiction of a particular community.
Among the other factors highlighted by the county as contributing to lack of
access for people are considered the result of cultural and linguistic “island
communities” “If you consider that social services, including mental health
treatment services, have traditionally been developed for majority populations,
it is important to look at areas where sizeable numbers of a particular ethnic
group reside who may be isolated within the larger community. Such isolation
functions as barrier toward accessing mental health services and undoubtedly
fuels the disparities in care that are of most concern[…]of the most
disadvantaged individuals in society. In terms of mental health, linguistically
isolated families may not be receiving information on where or how to get help
when a family member needs it.”(PEI Community planning Data 2008).
The study area I chose was initially all of Los Angeles County,
but then I limited it to a single service area as defined by the County. The
area I chose was the Antelope Valley which was the smallest and most isolated
part of the county. According to the service area executive summery the area is
“home to only two cities: Palmdale and Lancaster. Overall, the service area has an almost equal number of people who identified themselves as Latinos and Whites. Examining the two urban areas reveals a somewhat different ethnic distribution. In the Lancaster area, no ethnic group has a majority. The Western European White population is more numerous than the Latino. Additionally, African‐Americans account for 20% of the population in the area. In the Palmdale area, on the other hand, Latinos are the majority ethnic group, followed by Western European Whites and African‐Americans who constitute 10% of the local area population”.
Although this area is not so much linguistically or culturally isolated, “The overall “Penetration Rate” as determined by the county for Service Area 1 was 0.32, and along with Service Area 6, this was the highest rate seen across the county. Relatively speaking, this indicates that treatment services may be reaching the SMI population here to a greater degree than found in other parts of the county … Asians (0.08) were the least served by county mental health services. Penetration rates for the other major ethnic groups were as follows: the Latino population (0.21), the White population (0.25), the Native Ameri‐can population (0.30) and the African‐ American population (0.82).
Based on this data I would cross check the locations of the mental health care providers I have and see if it matches up.
Methods:
It became clear to me at this point
that the complexity and scope of mapping mental health access/use requires a
lot of economic, cultural and infrastructural data all in conjunction. I would
need to simplify my scope to do anything meaningful.
In order to assess the relative needs within an urban area, I
obtained census tract TIGER data from the 2010 Census(https://www.census.gov/geo/maps-data/data/tiger-data.html).
I chose to use the shape file format that was pre-joined with selected
demographic information A. study out of the UC Davis school of medicine which
used a GIS to measure Mental Health Needs, Utilization and Access“ Census tract
level data allows for a community level analysis to be performed and studied
within the social context of that county (unemployment rates, level of poverty,
number of people who are uninsured, etc.). This might be considered an ideal
geographic level for understanding health disparities in this population since
it is said that census tracts mimic neighborhoods in their homogeneity” ( von
Friederichs-Fitzwater 2011) . To have larger enumeration units for analysis
would be too general in terms of seeing societal variance in mapping health
inequality.
Upon acquiring the profile of I ran a definition query to limit the polygons to Los Angeles County and I added the shape file of Mental Health Care Providers. This was the most complete dataset created in this subject for the state of California it contained “ information on the locations of publicly funded Outpatient Mental Health Services and 24 Hour Acute Psychiatric Inpatient Care facilities served by the County of Los Angeles, Department of Mental Health (LACDMH). It does not include information on individual names of clinicians.”
At this point, I ran a definition
query to only include service area “one” in an effort to reduce scale. This
service area encompassed the Antelope Valley which includes the city of
Lancaster and Palmdale. I then found the relevant census tracts within the
Antelope Valley and exported the selection set. This was when I was able
project the tract polygons into the correct the correct state plane coordinate
system. I then was able to look at the demographics of the areas surrounding
the care providers.
I created buffer polygons to see what the demographics looked
like outside of 1 mile a provider. I used a mile because I wanted to represent
a fairly walkable distance for someone who didn’t have access for was
interested in seeing the how the populations of whites, Latinos, blacks, Asians
were spatially related to the locations of the care providers. After selected
features by location I could see that.
Results:
It was determined that 181,145 people live within a mile of a
care provider and 209,374 live over a mile away. Of those who live over a mile
away: 120,332 were white, 90,420 were Latino 27,112 were black and 7,973 were
Asian. Thus, Of the 209,793 total whites about 57% live over a mile away, 52%
of Latinos (total 171,862), 45% of Blacks (total 59,432) and 51% of Asians
(total 15,375).
Asian
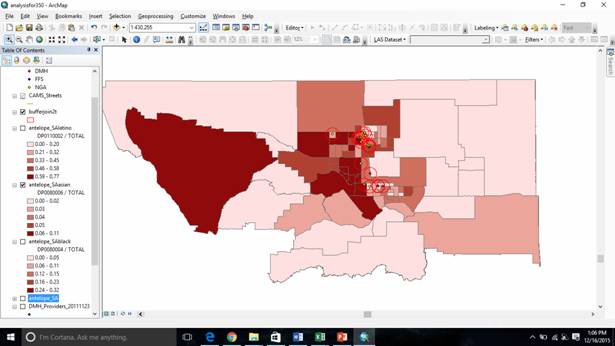
African Americans(Figure2)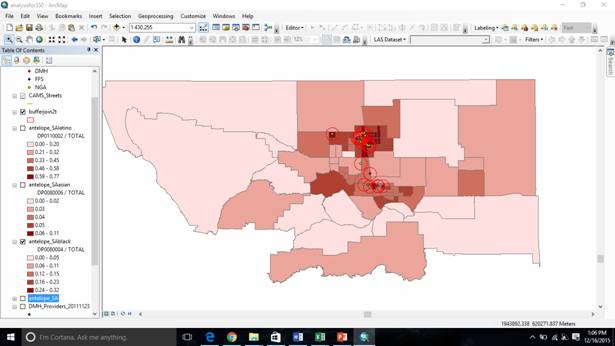
White 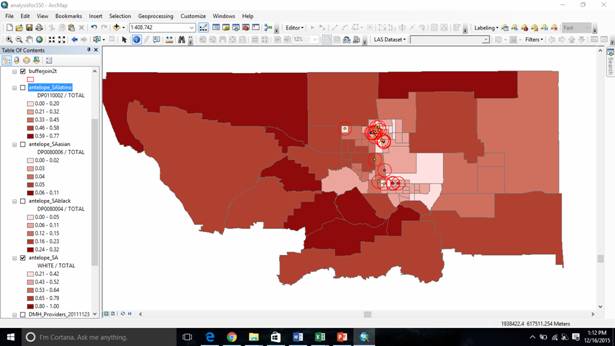 Latino
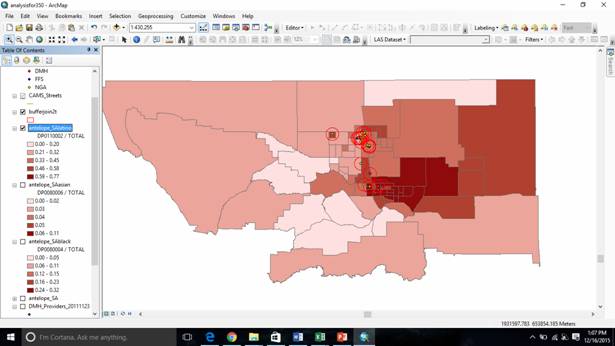
Red circles represent 1 mile buffer. Natural Breaks Classification method
Analysis:
These findings seem to slightly begin to reflect the
reality facing underserved people even though the straight distances from the
providers don’t reflect the economic realities of affluent suburban commuters
vs urban poor.
Visually, it appears as if the African Americans populations are most clustered around mental healthcare providers which does reflect the fact that they are considered to have most “penetration” rate. The polygons representing over 25% black population are all within one mile of a provider. Asian Americans seemingly have the highest concentrations furthest away from any of the buffer polygons. Latinos who seemingly are concentrated in Palmdale, appear to occupy the majority of the polygons that are outside of the buffer that are in urban areas. Whites have the highest concentration, the furthest away from the buffers but without doing economic analysis in conjunction with purely distance, it is hard to see which communities are geographically underserved and which are affluent suburbs with people who have the means to get transportation to mental health care providers.
Difficulties/Issues:
I did not have access to reliable economic data that could
be joined to my tract polygons thus my analysis was extremely limited. I had
many issues navigated the census shape file and figuring out GEOID and lookup
codes. The time is take just to sort through one data to make it appropriate
for analysis is always underestimated. The data fields in the care provider
file were extremely complete, but with a sloppy organization. I also found
that creating a file geodatabase was extremely difficult because applying the
appropriate transformations to make all the layer’s spatial reference because
of this it was harder to organize my files than it should have been.
Conclusion:
Conceptually, the idea of creating an index of some kind for assessing relative need of mental healthcare is an extremely complicated process involving spatial, economic, transit and cultural data all in conjunction. It requires someone who has experience in the field working in the actual areas. I feel that what I did was a microscopic portion of the analysis required. Obtaining quality data that is well organized and easily accessible is extremely difficult. However, I feel that my analysis shows the very outline of the demographics of the Antelope valley and the spatial relationships between those people.
References:
Fradelos, Evangelos C. et al. “Health Based Geographic
Information Systems (GIS) and Their
Applications.” Acta Informatica Medica 22.6 (2014): 402–405.
PMC. Web. 16 Dec. 2015.
Green, Stuart A.et.al. "Mapping Mental Health Service
Access: Achieving Equity through Quality
Improvement." Journal Of Public Health 35.2 (2013): 286.
EbScoHost. Web. 15 Dec. 2015.
PEI Community Plana Data Los Angeles County Department of Mental Health. Service Area 1 Executive Summary AntelopeValley. N.p.: n.p., n.d. 2014. Web.
Von Friederichs-Fitzwater, Marlene M. et.al."Using
Geographic Information Systems (GIS) to Understand
Mental Health Needs, Utilization and Access within a Social
Context in California and in Three
Selected Counties." (2011): n. pag. Mental Health Services
Oversight and Accountability
Commission. Web. 15 Oct. 2015.